A Tour of the User Interface
While Stochastix is fully operable from the command line, it also comes with a rich, modern web interface to help you visualize data and results.
After starting the environment (see the Getting Started guide), you can access the UI by navigating to https://localhost in your web browser.
This page provides a quick visual tour of the main sections of the application.
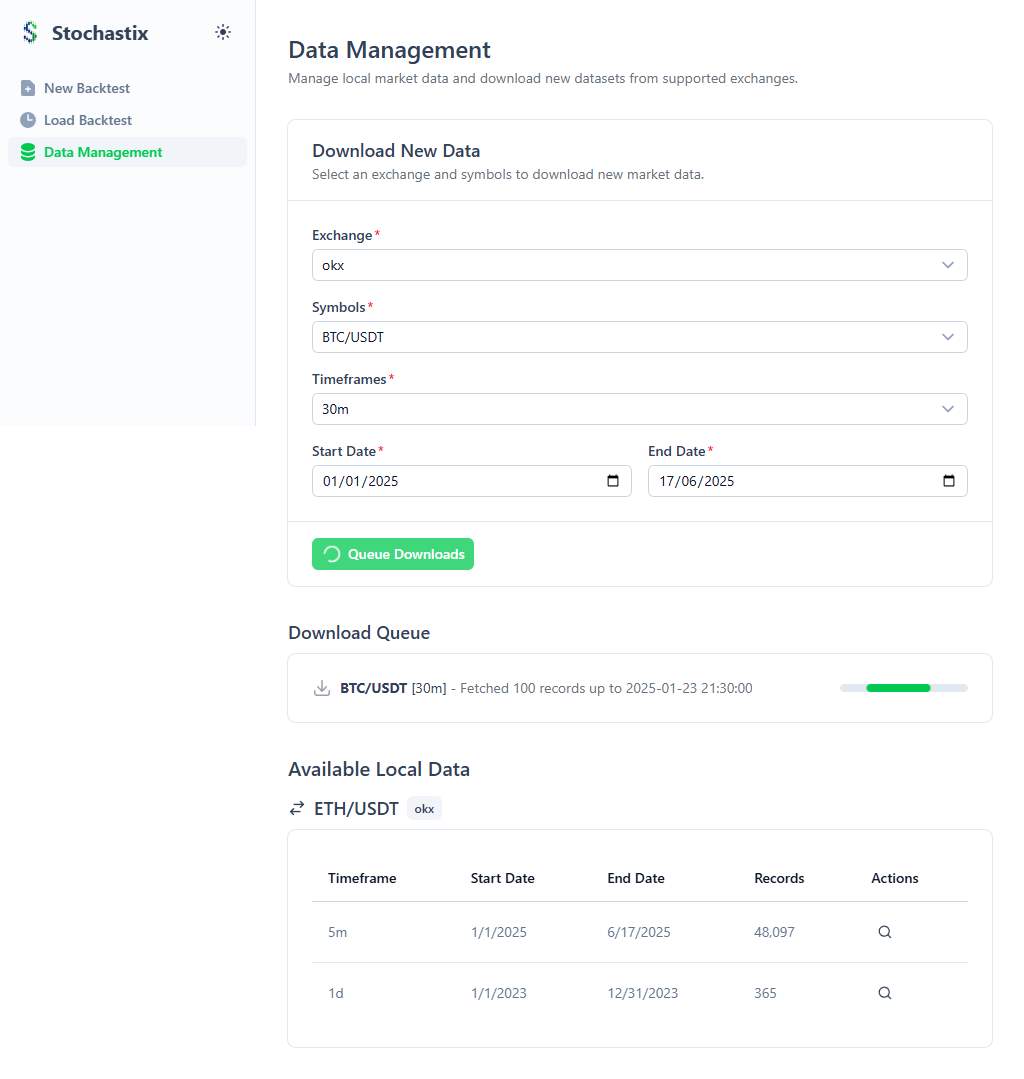
Data Management
The Data Management page is the central hub for downloading and inspecting historical market data. From here you can view all available data, initiate new downloads from an exchange, and inspect the integrity of local files.
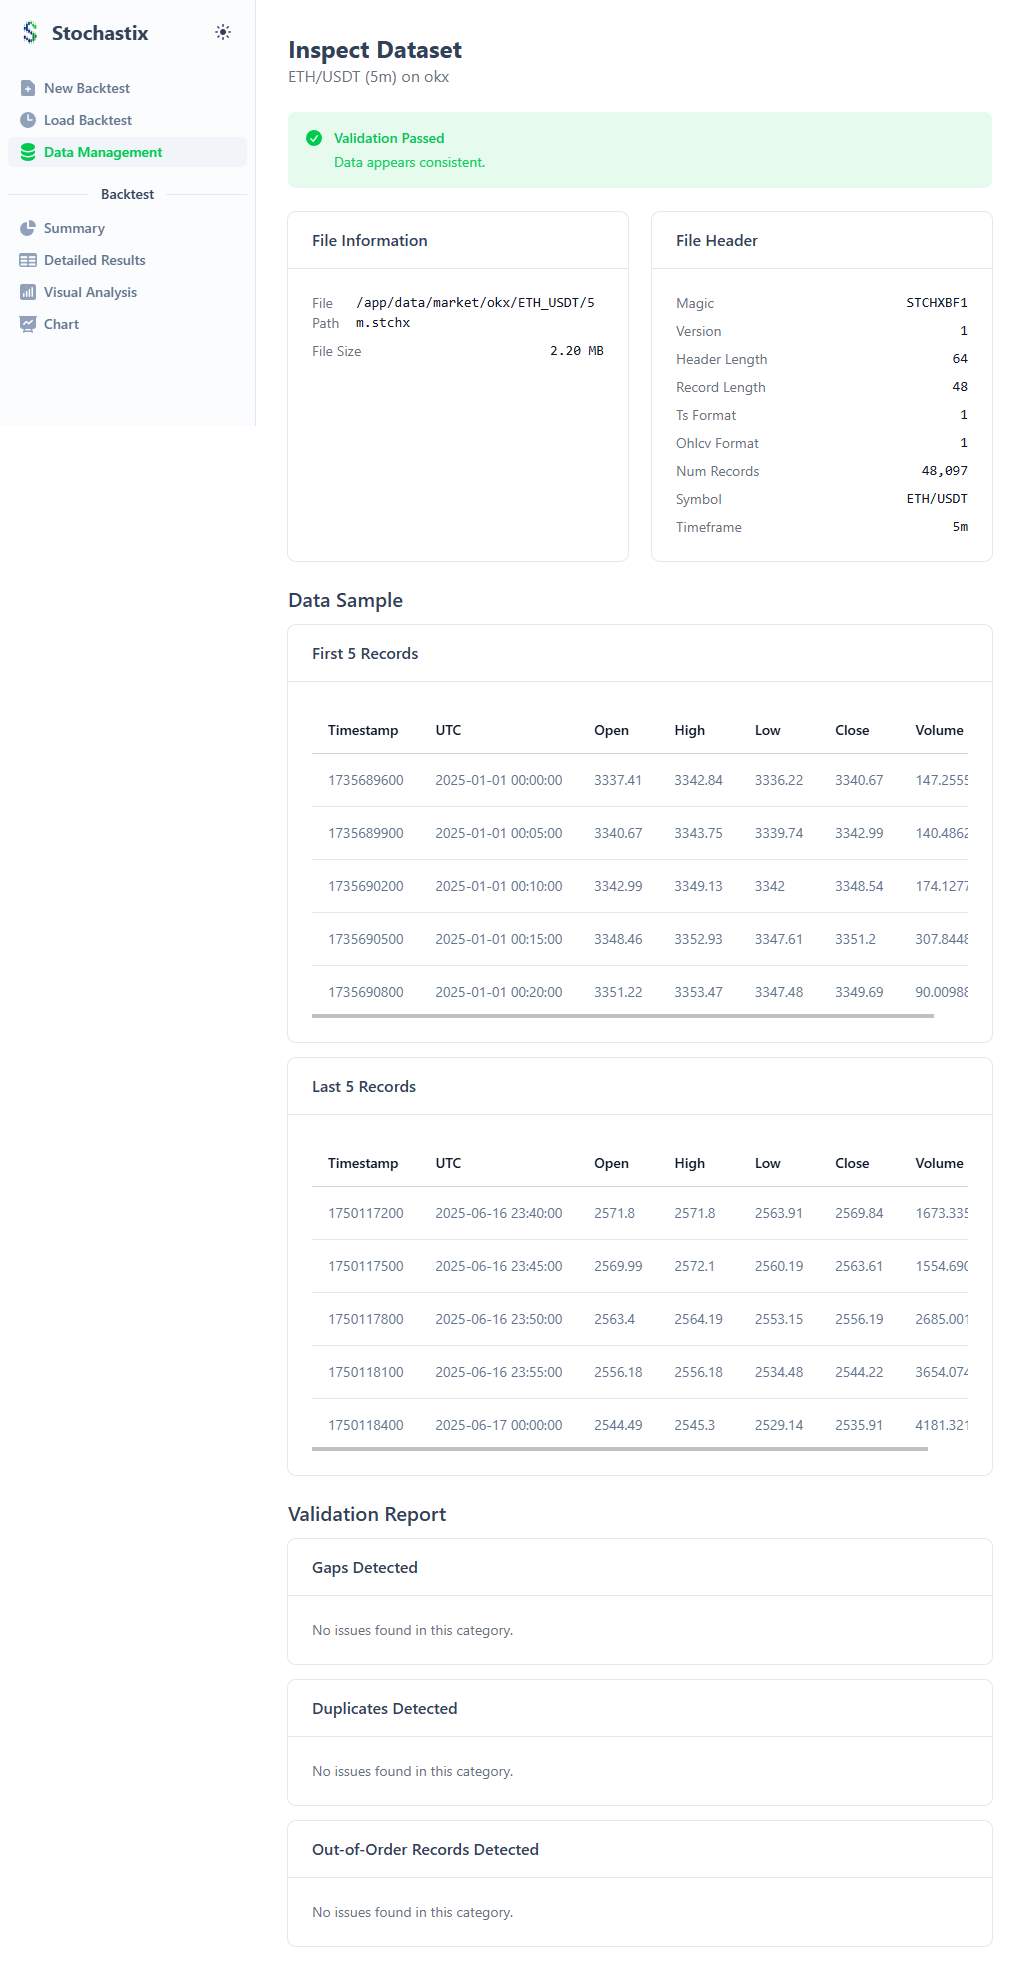
Data Validation
From the Data Management page, you can inspect any downloaded .stchx data file. This opens a modal window that displays the file's header metadata and provides a full data integrity report, checking for gaps, duplicates, or out-of-order records.
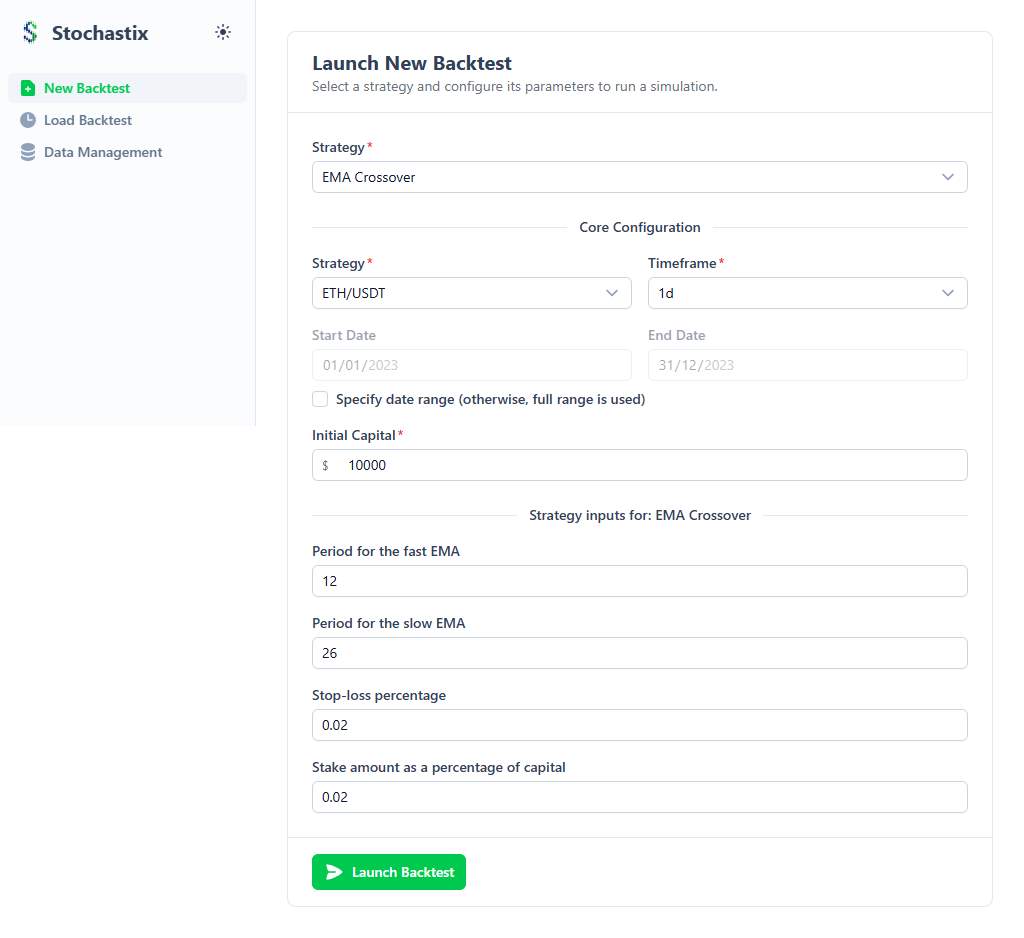
New Backtest
The New Backtest page allows you to visually configure and launch a backtest for any available strategy. It dynamically generates form fields for all the #[Input] parameters defined in your strategy class, making it easy to experiment with different settings.
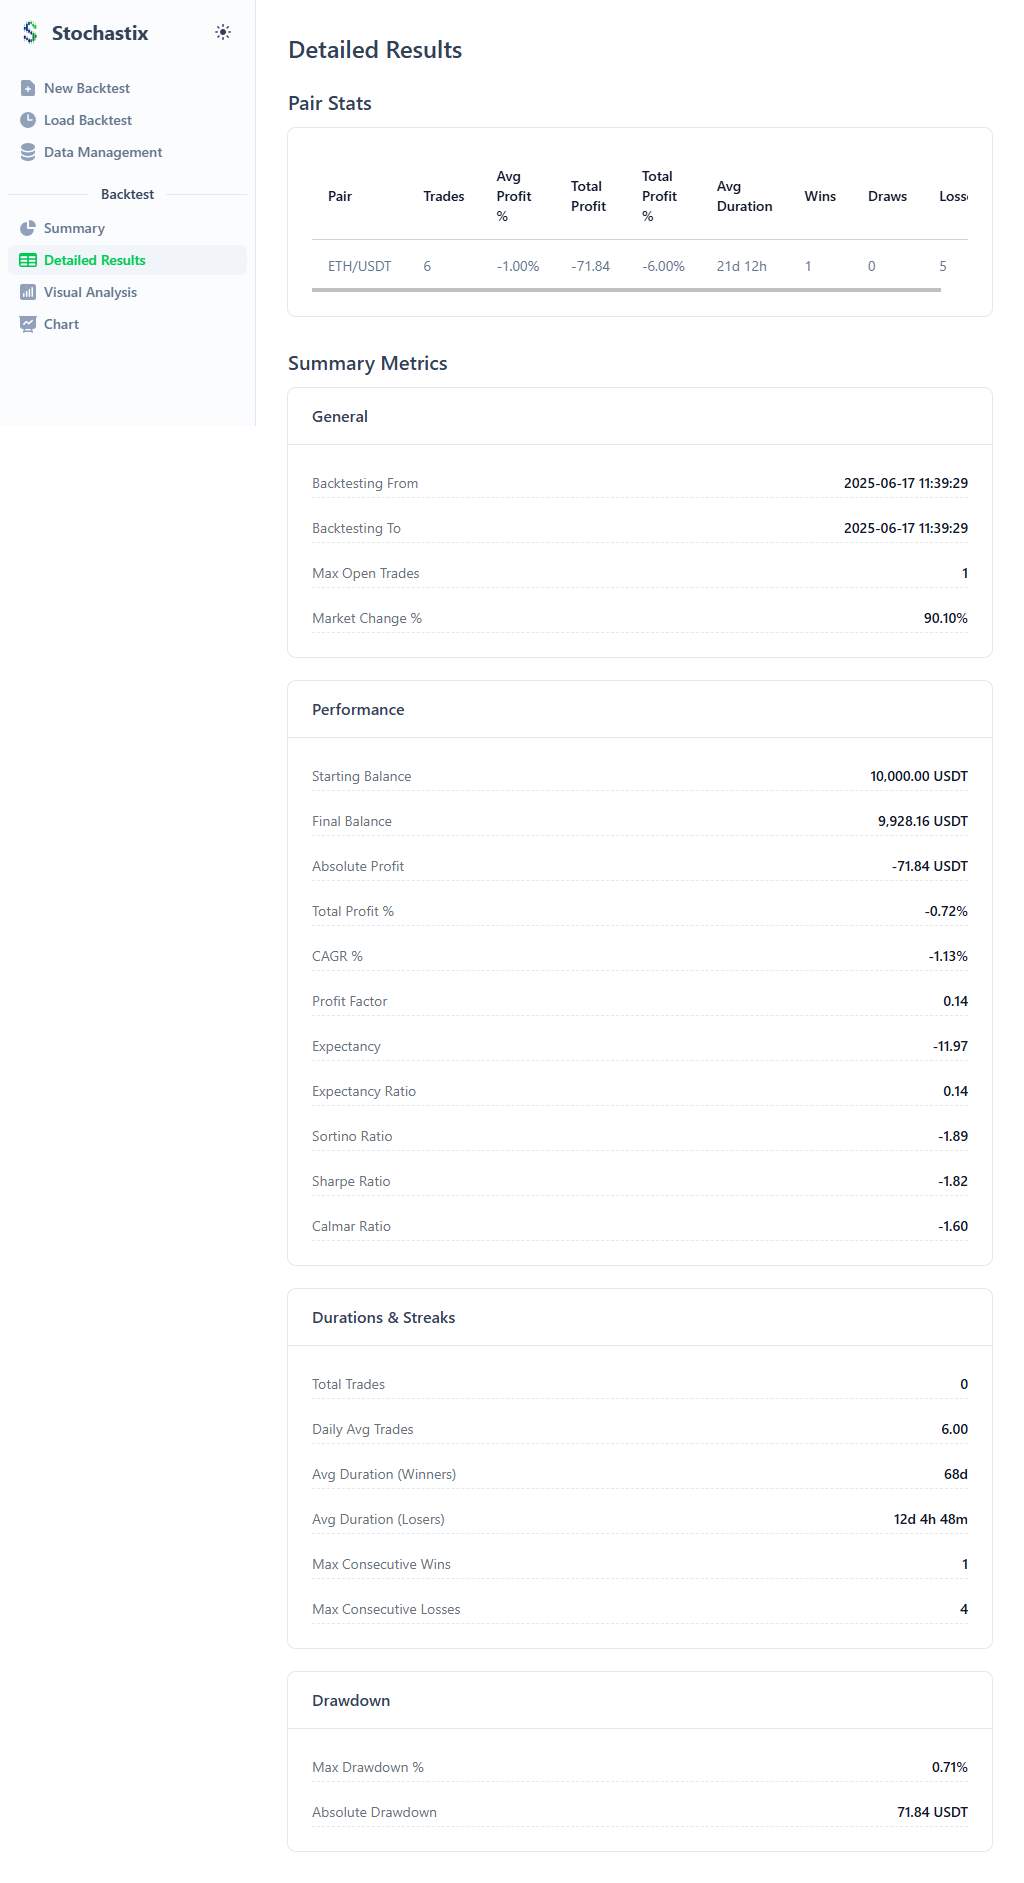
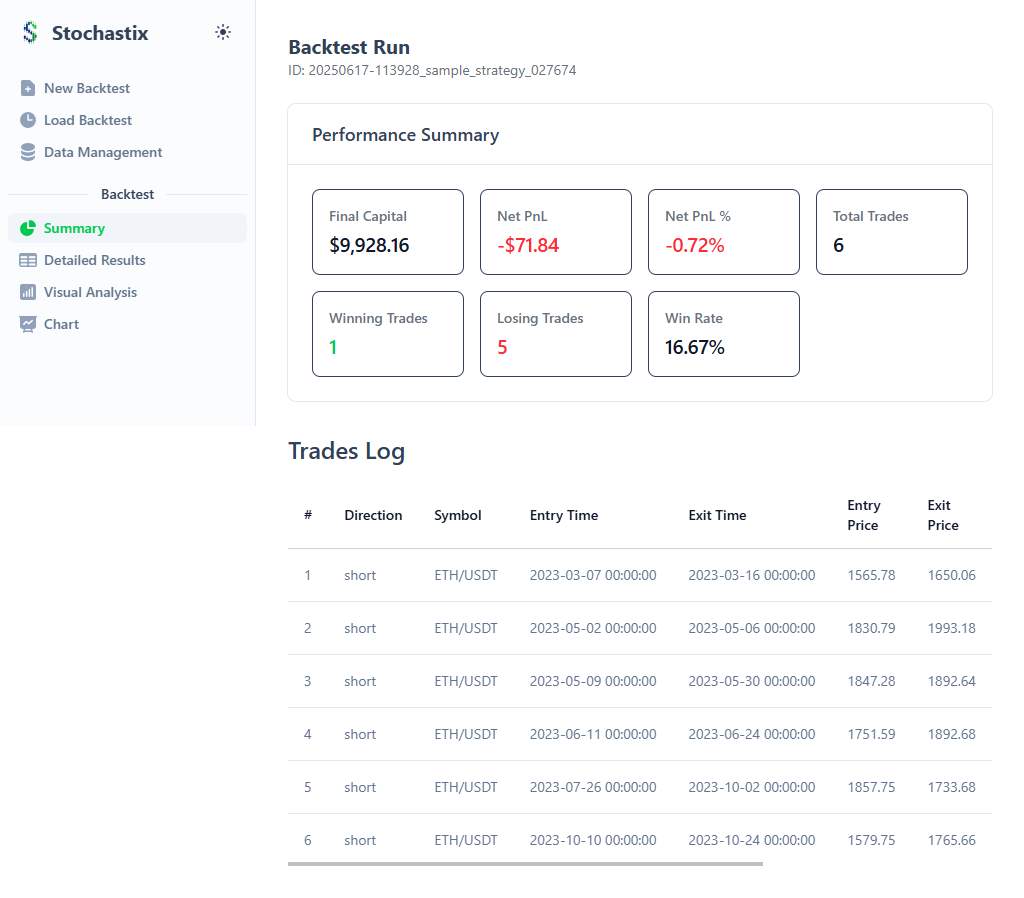
Backtest Results
The Backtest Results page provides a comprehensive and interactive overview of a completed backtest run, broken down into several key sections.
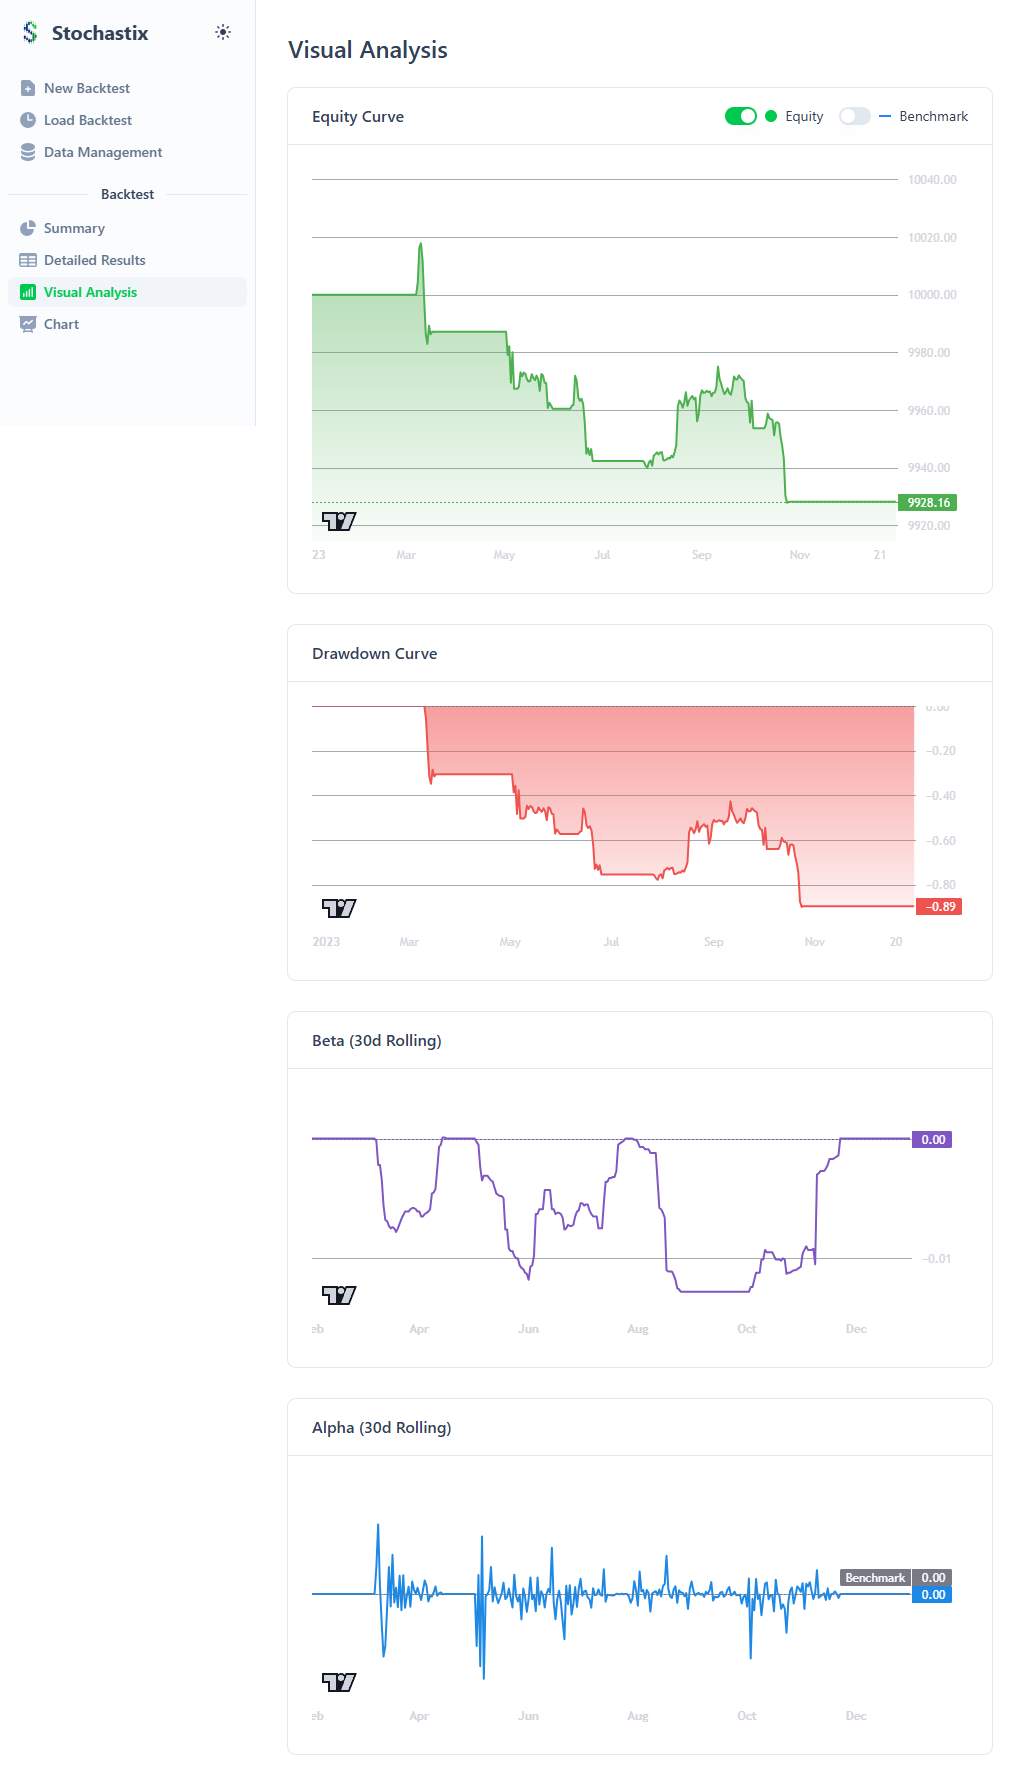
Summary & Performance Charts
The top of the page displays the most important, high-level performance metrics of the strategy alongside interactive charts for visualizing the portfolio's equity curve, drawdown, and other time-series metrics.
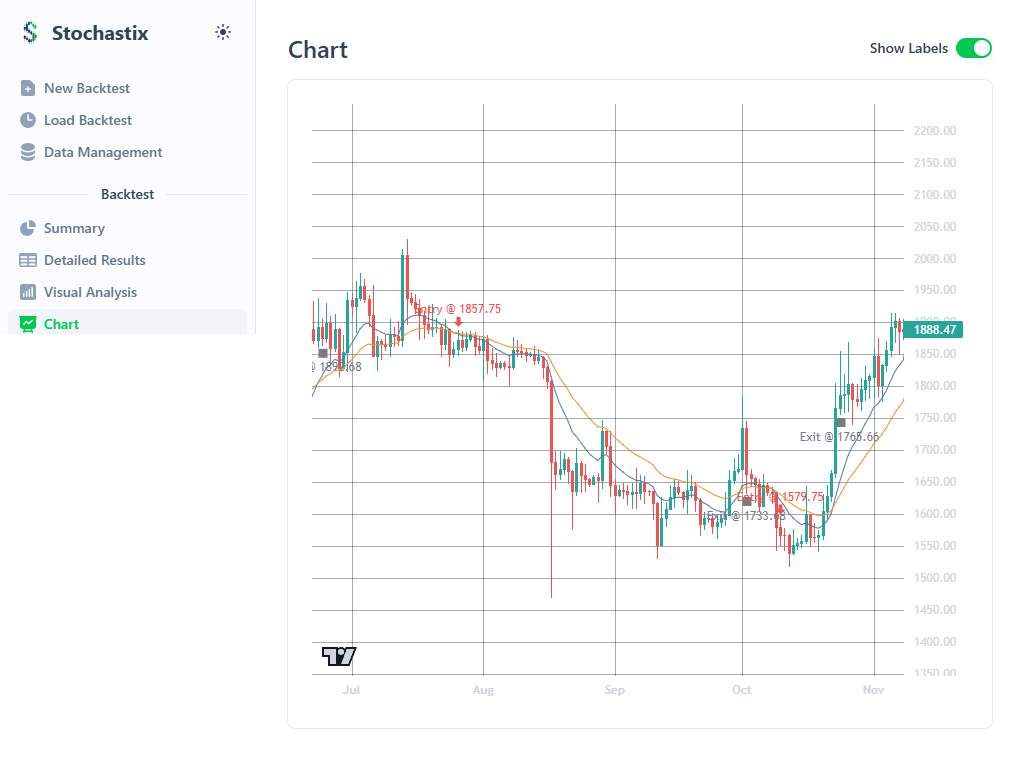
Visual Chart Analysis
The main chart allows for deep visual analysis, overlaying your strategy's indicators and plotting the exact entry and exit points of each trade directly on the price candles. You can zoom, pan, and inspect each trade in detail.
Trades Log & Analysis
Below the charts, detailed tables provide a log of every closed trade and a performance breakdown by the enterTags and exitTags assigned in your strategy.